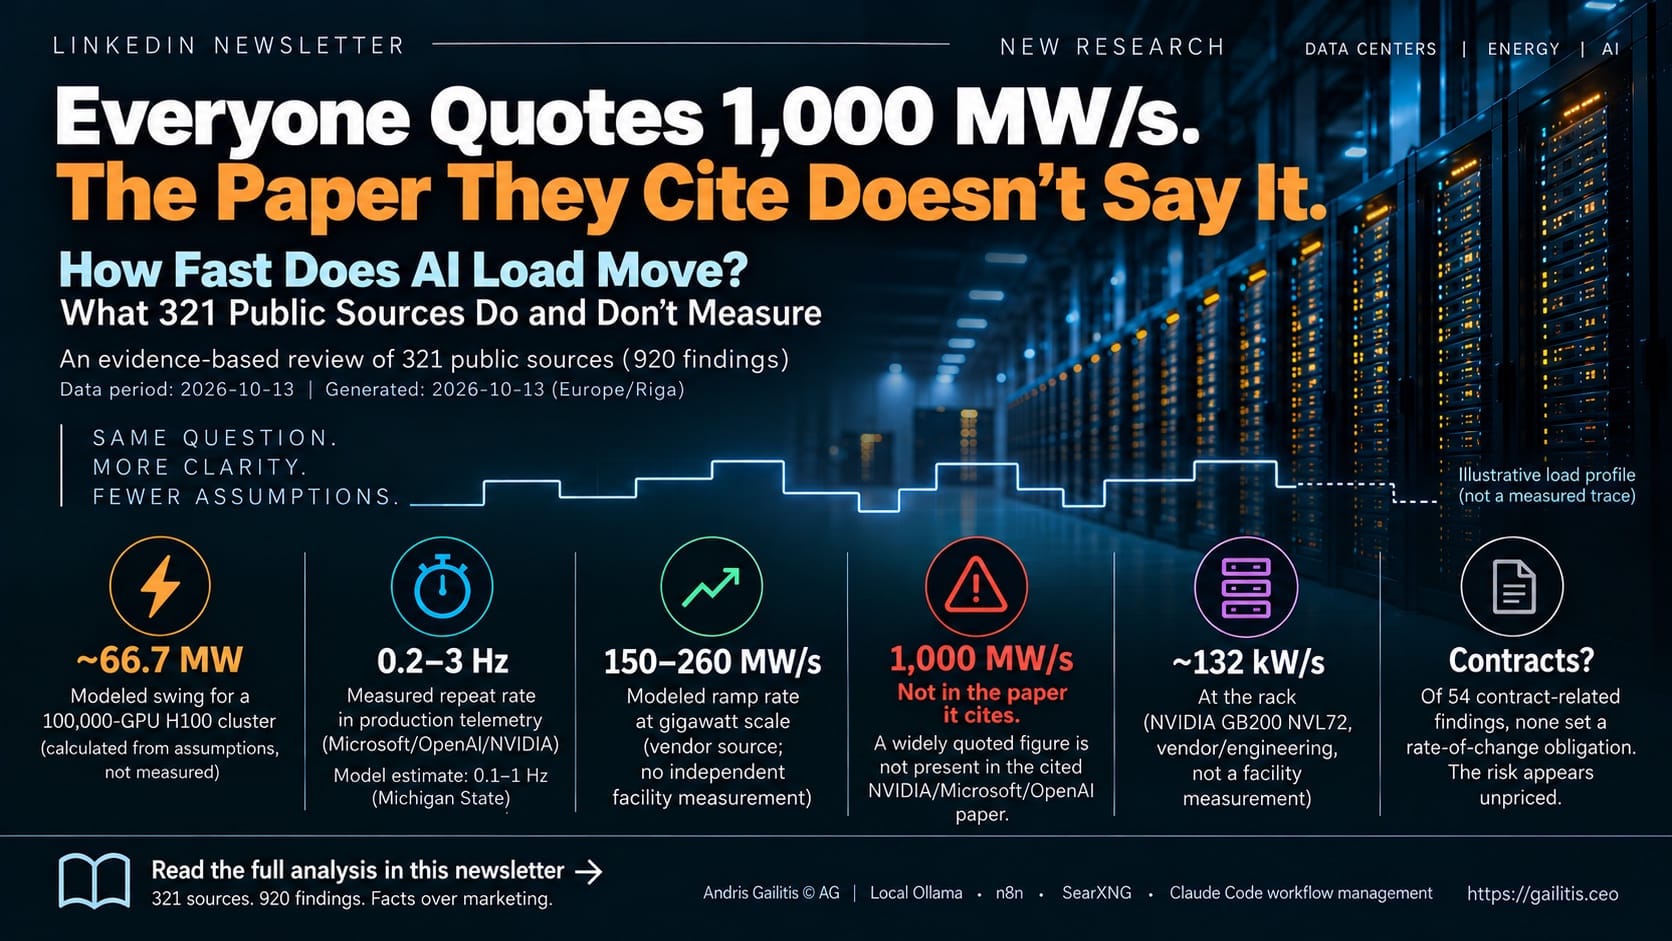
The most quoted number in AI data centre power is that a gigawatt-scale site can ramp at more than 1,000 megawatts per second. I went to read the research it is attributed to. The number is not in it.
That is not a gotcha about one article. It is the condition of the whole field. We reviewed 321 public sources and extracted 920 findings on how fast AI compute load moves. There are plenty of numbers in circulation. There is, as far as the public record goes, one set of production measurements from an operator – and it does not report a ramp rate.
Where the number comes from
The citation trail is short. A sponsored article on T&D World, placed by a monitoring vendor, states: “Research published in August 2025 by NVIDIA, Microsoft, and OpenAI documented ramp rates exceeding 1,000 megawatts per second at gigawatt scale.” No link. No citation.
There is exactly one piece of research matching that description: Power Stabilization for AI Training Datacenters, arXiv:2508.14318, posted 21 August 2025 by authors from Microsoft, OpenAI and NVIDIA. It is a serious paper, grounded in real production telemetry.
It contains no ramp rate value. It discusses ramp rate in MW/s as a concept. It notes that GB200 ramp limits are programmable in watts per second. It gives no number for either. On amplitude it says swings “can amount to tens or hundreds of megawatts” – a general statement, with no measurement attached, and the one concrete case it points to is a vendor case study.
So the largest number in the field is an uncited attribution, in sponsored content, to a paper that does not make the claim.
What that paper does measure
This is the part worth reading, and almost nobody quotes it.
From production telemetry on an at-scale DGX-H100 training job, the authors report that the power trace has its FFT energy concentrated between 0.2 and 3 Hz.
Seconds. Not milliseconds. The industry’s favourite word for this phenomenon is “milliseconds”, and the only people who have published a frequency analysis of a real training job at scale put the energy three orders of magnitude slower than that.
Which is worse, not better. A millisecond transient is a filtering problem – capacitors, chokes, a power shelf. A 0.2-3 Hz oscillation with tens of megawatts behind it is in the band where power systems have modes of their own. You do not filter that out at the rack.
The other famous number is a calculation
The second figure in wide circulation is 66.7 MW of swing for a 100,000-GPU H100 cluster. It is real, it is from a peer-reviewable source, and it is not a measurement.
It comes from A Pre-Dispatch Resonance Safety Criterion for AI Training Clusters (arXiv:2606.22096, Michigan State University, June 2026), and the paper is transparent about it: the figure is derived from 100,000 GPUs multiplied by the difference between 700 W design power and roughly 100 W idle, divided by a 0.9 power chain efficiency. The authors state it is an upper bound and that real production waveforms are smoother.
Same paper, same honesty, on the frequency: iteration periods of one to ten seconds give a forcing frequency of 0.1-1 Hz – and they attribute the one-to-ten-second range to the production measurements in the Microsoft/OpenAI/NVIDIA paper, not to their own.
The chain closes on itself. Every serious number in this field traces back to one telemetry dataset, and that dataset reports a frequency band, not a rate of change.
The number nobody quotes
Buried in the corpus is an MIT-licensed GitHub repository – analysis code built on a published H100 measurement dataset, 16 nodes of real training traces, by an individual rather than a company. It is the only independent, reproducible analysis in 321 sources. Nobody cites it.
It models what those traces look like aggregated to data centre scale:
| Scenario | Synchronisation | Mean | Peak | Peak-to-average |
|---|---|---|---|---|
| 25,000 H100 | Fully synchronised | 13.1 MW | 18.9 MW | 1.44 |
| 100,000 H100 | Fully synchronised | 52.4 MW | 75.6 MW | 1.44 |
| 1 GW facility | Fully synchronised | 877 MW | 1,266 MW | 1.44 |
| 1 GW facility | Fully random | 877 MW | 879 MW | 1.00 |
Read the last two rows again. Same gigawatt of compute, same mean draw. Synchronised, it peaks at 1,266 MW. Randomised, at 879 MW.
The problem is not the hardware. It is the lockstep. A 44% peak premium exists for one reason: thousands of accelerators finishing the same step at the same instant. Nothing about the chip, the rack or the cooling creates it.
That reframes the engineering response. Capacitors in the power shelf, supercapacitor banks, battery buffers – all of it absorbs a swing that software created and software could stagger. The industry is building hardware to smooth a scheduling artefact.
One more thing that table does: at 100,000 H100 it puts the synchronised swing at 23.2 MW. The famous number for the same cluster is 66.7 MW. An independent model of real traces lands at roughly a third of the figure the field quotes.
What the public record actually holds
| Claim in circulation | What the source actually is |
|---|---|
| >1,000 MW/s at gigawatt scale | Sponsored article, uncited, attributed to a paper that does not state it |
| 970 to 425 MW every 20 s; 147 MW in 100 ms | Vendor solutions page |
| 260 MW/s across eight jobs; 150 MW/s across three halls | Same vendor page – the only numeric ramp source in the review |
| 66.7 MW swing at 100,000 GPUs | Peer-reviewable paper, explicitly a calculated upper bound |
| >132 kW/s per GB200 NVL72 rack | Vendor engineering material |
| 160% of nominal over 400 microseconds | Vendor technical page |
| FFT energy at 0.2-3 Hz, at-scale H100 job | Production telemetry. The one operator measurement. |
| Peak-to-average 1.44 synchronised, 1.00 random | Independent model on published H100 traces |
Out of 179 findings specifically about rate of change, three carry a numeric value under any serious grading. All three come from the same vendor solutions page.
I want to be precise about what that does and does not mean. It does not mean the fast ramps are fictional. The engineering response – capacitor banks in the power shelf, 65 joules of storage per GPU on GB300, Meta running dummy kernels during power dips, supercapacitor banks rated to 420 kW and 75 MW – is real, expensive, and nobody builds that against an imaginary problem. It means the industry is acting on a quantity it has not published.
The grid has seen something. It is not the same thing.
Observations from the utility side, each with a place and a date:
- Dominion Energy: 14.7 Hz oscillations, roughly 4% peak-to-peak in voltage, at a 115 kV substation.
- Texas grid operators: 23 Hz oscillations in real power measurements near a large electronic load, October 2024.
- Meta data centres: oscillations at 49 Hz and 71 Hz, back in 2017.
- PMU and waveform data reported by a grid-monitoring practitioner: roughly 7.5 Hz at 25 MW peak-to-peak, and 23 Hz at 50 MW peak-to-peak.
These are more valuable than any vendor figure, because the people who recorded them were not selling a solution.
But they are not the training cycle. The workload oscillation lives at 0.2-3 Hz. Nothing in a training iteration produces 23 or 71 Hz. Those are in the band where converter controls interact – the power electronics, not the compute schedule. One phenomenon, two mechanisms, and treating them as the same thing is the fastest way to lose an engineering audience.
Note what that means for amplitude. The only oscillation magnitudes anyone has measured at a substation – 25 MW and 50 MW peak-to-peak – sit in the converter band, not the training band. For the training cycle itself, we still have a calculation and a model.
What connects them is the cause: a very large, very fast, electronically-coupled load that the grid did not previously have to model.
Four racks
Here is a piece of arithmetic. It is arithmetic, not evidence, and I am labelling it as such because that distinction is the entire point of this article.
MISO – the US grid operator covering fifteen states – now caps new large-load ramp at 30 MW per minute. That is 500 kW per second for an entire site.
The published figure for a single NVIDIA GB200 NVL72 rack is above 132 kW/s.
500 divided by 132 is 3.8.
Fewer than four racks, moving in sync, would consume the whole ramp allowance a regulator imposes on the facility. Not four halls. Four racks. If that arithmetic is even approximately right, the gap between what the hardware does and what the grid will permit is not a 2030 problem.
Who is writing rules about it
| Jurisdiction | Rate-of-change requirement on large load |
|---|---|
| MISO (US) | 30 MW/min cap on new large loads |
| ERCOT (US) | Mandatory curtailment above 75 MW |
| PJM (US) | Non-Capacity-Backed Load category |
| NERC (US) | Proposed registration at 20 MW aggregated computational load, 60 kV and above |
| Ireland, Poland, France, Denmark | None found |
Across the European grid-code material in this review – Ireland, Poland, France, Denmark – not one entry sets a rate-of-change limit on a large load. The European rules we found are about voltage quality, flicker, ride-through and connection capacity. EN 50160 characterises what the network delivers to you. Ireland’s DCCOPP V3 demands dispatchable generation or storage equal to 100% of maximum import capacity before a connection offer issues – which is a very strong requirement, and it is about capacity, not about speed.
Honest scope: Germany, the Netherlands, Finland, Sweden and the ENTSO-E Demand Connection Code were not covered in this review. The negative holds for the codes listed, not for Europe as a whole. If a German or Dutch connection condition already caps load ramp, I would rather be told than be right.
As it stands, the only explicit large-load ramp limit anywhere in 321 sources is American.
And the contracts say nothing at all
Fifty-four findings in this review relate to colocation contract terms. Not one is an actual contract setting a rate-of-change obligation.
What they do contain is instructive: $100-150 per kilowatt per month, five to ten year terms, financial security of $50,000 per MW of contracted peak, ramp schedules that mean billing ramp – 25% of capacity billable in month one, 100% by month seven. The word “ramp” appears in colocation contracts. It refers to money.
Capacity is priced. Consumption is priced. Rate of change is not mentioned.
I have to be careful here, because this is absence of evidence. Private contracts are private; a bilateral agreement between a hyperscaler and an operator may well contain a load-behaviour clause that nobody publishes. What I can say is that nothing in the public record prices it, and a risk that nothing in the public record prices tends to be carried by whoever owns the switchgear rather than whoever causes the swing.
Most of the industry does not know this is a topic
I need to say something the research cannot say for me, because I sit in these rooms.
Among operators, equipment manufacturers, consulting engineers, designers and the people who actually sign colocation contracts, this does not come up. Not out of carelessness. The load pattern changed faster than the shared vocabulary did, and there is no standard, no checklist line and no RFP question that forces anyone to ask about it.
The evidence in this review shows the same thing from the outside. A figure of 1,000 MW/s circulated for over a year without anyone opening the paper it cited. The only independent, reproducible analysis in 321 sources is one person’s GitHub repository, and nobody cites it. Nine hundred and twenty findings produced a single recorded contradiction. A field that was genuinely examining this would be arguing about it.
That matters because of who is absent from the conversation. The person sizing the UPS, choosing the generator performance class, drawing the single-line diagram and setting the contracted capacity is mostly not in it at all. The specifications being written now, for halls that energise in 2028, assume a load that behaves the way load has behaved for twenty years.
I am not claiming the sky is falling. I am claiming that a question this basic – how fast does the load move, and what absorbs it – should not be this hard to answer, and that almost nobody is asking it.
What this study cannot tell you
- The actual ramp rate of a production AI cluster. No primary facility measurement in kW/s with a stated method exists in public. That is the finding, not a gap in the search.
- Whether one tenant’s oscillation degrades a neighbour’s power quality. Twelve findings, none with a measurement. Plausible mechanism, no evidence.
- Whether Europe has ramp rules we did not find. Four national codes checked. Germany, the Netherlands, the Nordics and ENTSO-E were not.
- How bad it gets. Operators publish mitigations, not incidents. The absence of reported failures is not evidence that there are none.
- Whether any of this applies to inference. Every number here is a training load. Inference is demand-driven, not iteration-synchronised. As the market tilts that way, the risk profile may change entirely, and nothing in 321 sources says how.
- What the volatility is worth. A site that can move 150 MW in a second is also the fastest frequency-response asset on the system. The corpus barely touches ancillary-service value – the same property that is a risk may be an asset nobody is buying.
- That there is any dissent. 920 findings produced one recorded contradiction, and it is about tariffs, not oscillation. Either the field agrees, or the search found only people who see a problem – most of whom sell a solution. For a body of evidence where nearly every number comes from a vendor, the absence of a sceptic is a weakness, not a confirmation.
Key takeaways
- The 1,000 MW/s figure is a sponsored attribution to a paper that does not contain it. Stop quoting it, including second-hand.
- The one production measurement puts the oscillation energy at 0.2-3 Hz. Seconds, not milliseconds – and that band is harder to deal with, not easier.
- Treat every amplitude number you see as a model until someone names a site and a method. The famous 66.7 MW is arithmetic from a datasheet.
- The utility-side observations at 7.5, 14.7, 23, 49 and 71 Hz are a different mechanism from the training cycle. Do not merge them.
- The whole effect is synchronisation. Peak-to-average is 1.44 in lockstep and 1.00 randomised – same compute, same mean. The industry is buying hardware to smooth a scheduling artefact.
- Rate of change is regulated in the United States and, in the European codes reviewed, nowhere. Contracts price capacity and are silent on speed.
For anyone signing or writing a colocation contract in 2027
Ask one question before the kilowatt price: what rate of change is this hall designed to absorb, and what happens on the shared block if a neighbour exceeds it. Nobody will have a documented answer, because no standard requires one. The answer you get will tell you more about the operator than the Tier certificate will.
And if you are an operator with telemetry on a real training cluster: publish the ramp curve. The first organisation to put a measured kW/s figure, with a method, into the public record ends an argument the entire industry is currently having with vendor slides.
Full research brief – 321 sources, 920 findings, every figure graded and every absence recorded: free PDF, no paywall
Get the next research first
I publish one evidence-based research report most weeks – free, no paywall, full PDF attached. Subscribe to Cloud, Colo & Data Center Pro and the next one reaches you the day it is out.
#DataCenters #AIInfrastructure #PowerInfrastructure #GridReliability #Colocation
Related articles:
Does AI Still Need Tier III? 59 Claimed It, Seven Could Prove It
Data Center Generator Lead Times in Europe
Tier 6: AI Is Redesigning the Data Center