When N+1 Isn’t Enough: Evidence From 184 Documented Data Center Outages

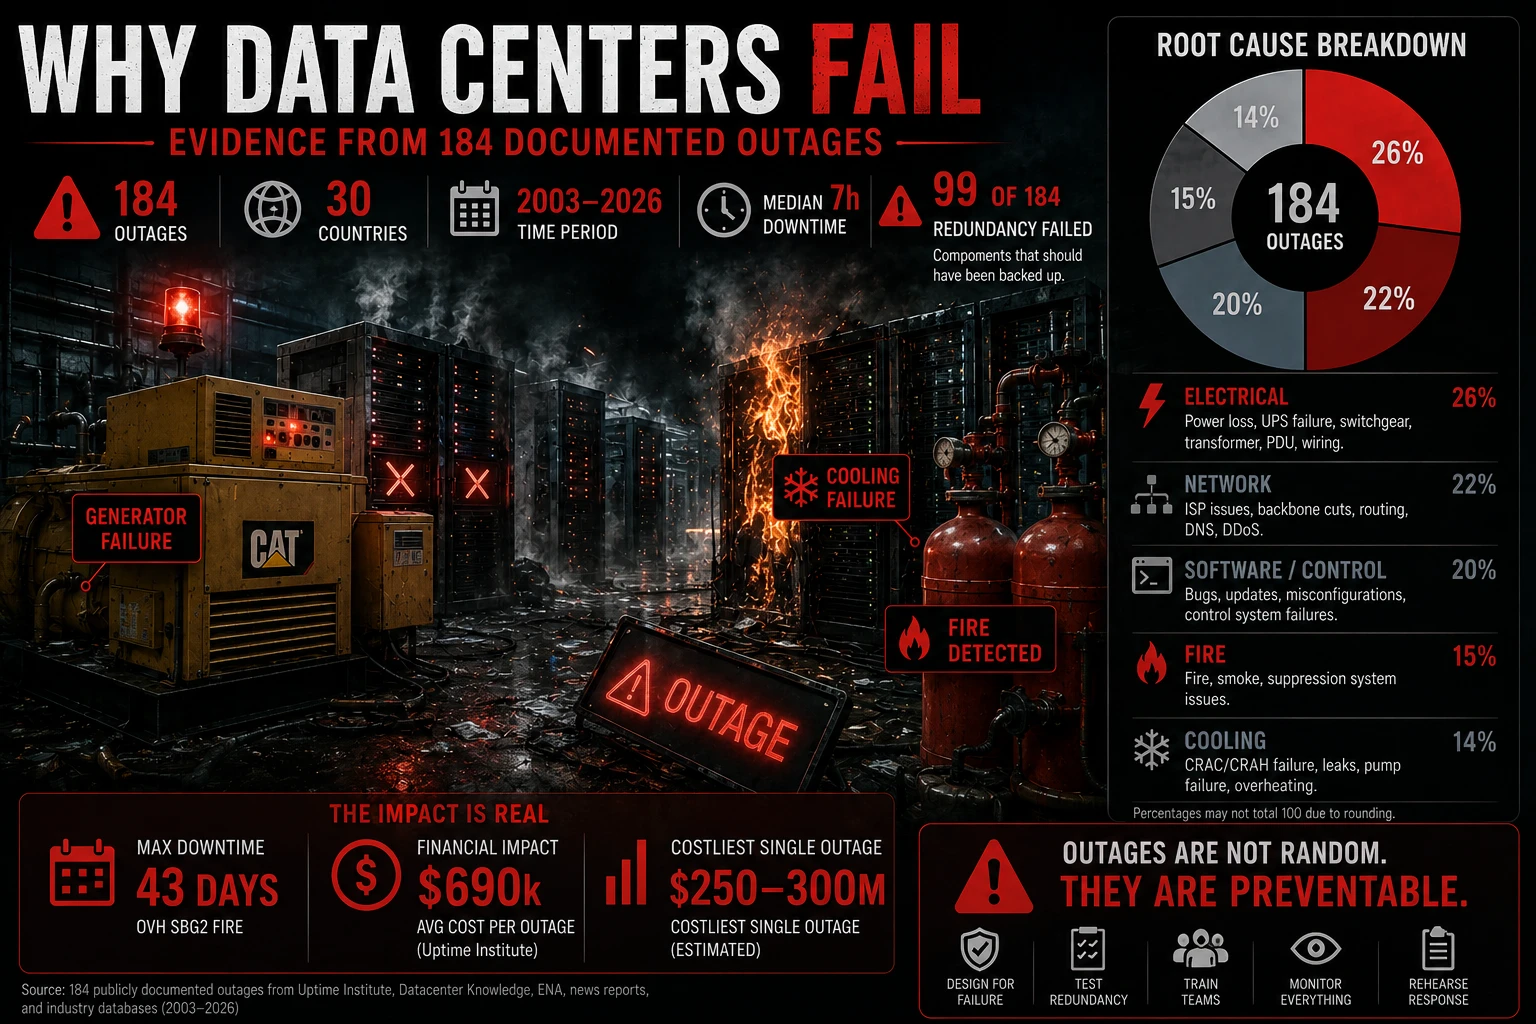
Why data centers fail - infographic of 184 documented outages, root causes and redundancy failures

Key takeaways

  • In 99 of 184 documented outages, redundancy existed – and failed anyway. N+1 on paper is not N+1 in practice.
  • The most common documented failure mode is boring: transfer switches (ATS/STS) that did not transfer when utility power dropped – followed by UPS batteries exhausted under load, and cooling that could not restart after a power event.
  • Root causes by category: electrical 26%, network 22%, software/control 20%, fire 15%, cooling 14% – the classic causes are stable, but every rising category is software and control.
  • Evidence base: 506 public signals filtered to 184 documented incidents across 30 countries (2003–2026), 59 with full post-mortems, median outage ~7 hours. Full sourced report attached.

Every data center sells N+1. And every outage post-mortem starts the same way: “despite redundant systems…” I wanted to know what actually happens in that gap between the promise and the failure. So we compiled 184 documented outages – 506 public signals, 59 high-impact events with full post-mortems – and asked one question: when redundancy fails, how exactly does it fail?

The uncomfortable headline: in 99 of the 184 documented outages – 53.8% – the systems that were supposed to provide backup were present and still failed. Redundancy did not save these facilities; it gave them a false sense of safety.

The most common documented failure modes are unglamorous.

Failure modeTypical chainTrend
ATS/STS failed to transferutility power drops → transfer switch does not switch → IT load loses powerstable
UPS/battery exhausted under loadpower fails → batteries degrade or run out before generators pick uprising
Cooling could not restart/ride throughpower blip → chillers fail to restart → thermal shutdownrising
BMS/control dependencyone control system fails → both “independent” paths die togetherrising
Maintenance/switching errorroutine work → redundancy accidentally taken offlinestable
Common-mode designone shared component (switchgear, fuel, control) → everything shares the failurefalling
Network config / BGP changeone configuration push → global outagerising

Look at the real incidents and a pattern emerges. In the OVH SBG2 fire (2021), there was no automatic extinguishing system in the battery/UPS rooms and the building design let the fire spread – a 43-day recovery. At Cloudflare (Nov 2023), generators could not be restarted manually because the access-control system had also lost power – the security system killed the security. At Equinix LD8 (2020), “A+B” feeds that were supposed to be independent were routed through a single UPS. Different companies, same lesson: in each of these cases, the redundancy appears to have been on the diagram, not in reality.

One more finding worth sitting with: “human error” appears in 182 of 184 incidents, but that number is misleading. Humans rarely cause outages out of nowhere – they trip a trap that bad design and weak process already built. The maintenance mistake that takes down a facility is only possible because there was no interlock, no isolation, no second check. Blaming the technician is easier than fixing the system that made the mistake fatal.

The trend line is clear. The classic physical causes – power, cooling, fire – are stable or falling as engineering matures. Everything that is rising is software and control: BMS dependencies, configuration errors, BGP changes that propagate globally in seconds. The modern data center increasingly fails not from hardware, but from code.

A note on method, because averages lie and vendor uptime claims lie more: every incident in this dataset is tied to a public, verifiable source, with confidence ratings where evidence was thin. The data skews toward large, well-documented operators and English-language reports – documented evidence follows the incidents that get published. This is not a complete census of every outage; it is an evidence base of the ones we can actually verify.

📄 Full research report (184 incidents, all sources): Download the PDF

When did your last failover test actually run – and did the switch actually transfer? 👇

#DataCenters #Uptime #CriticalInfrastructure #PowerInfrastructure

Related articles:

Who Keeps Europe’s Data Centers On? UPS Evidence From 36 Documented European Deployments

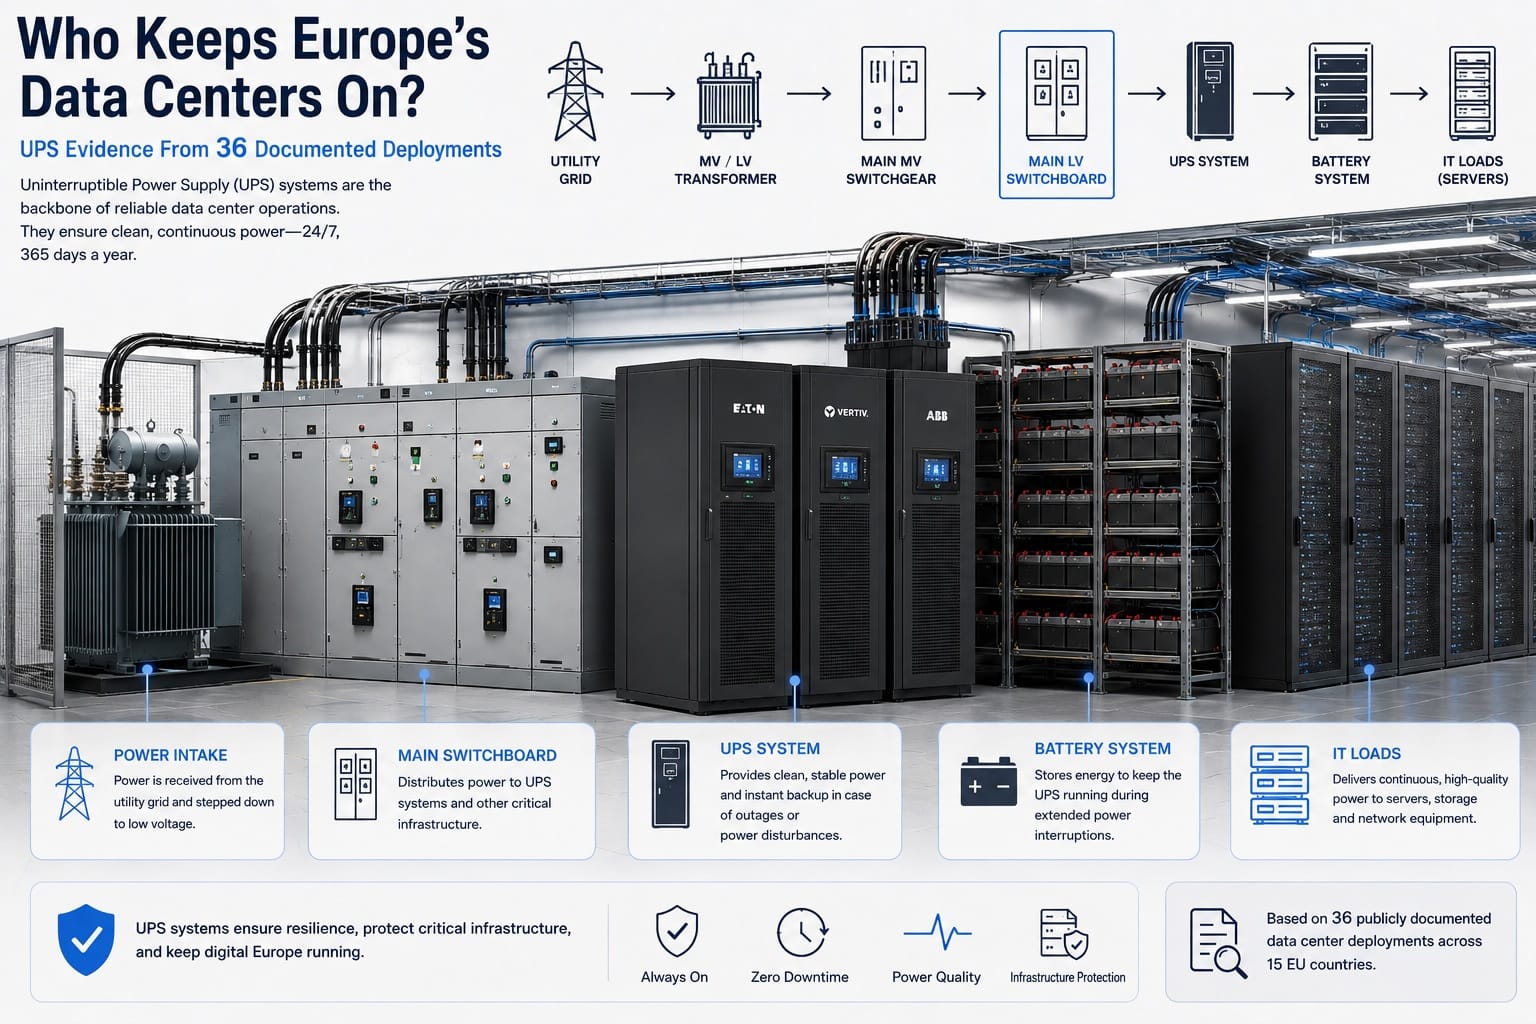
Data center power chain from utility grid to IT loads - European UPS deployment research cover

Key takeaways

  • Vertiv (7) and Riello UPS (6) lead documented European 1–2 MW UPS deployments – Liebert EXL S1 and Multi Power are the workhorse families.
  • Modular architecture is now the default: 15 of 36 documented European deployments. N+1 is the most common redundancy configuration (9 of 36).
  • Lithium-ion appears in 5 documented deployments and is clearly displacing VRLA; static UPS dominates with only 2 dynamic (rotary) installations in the dataset.
  • The evidence base: 364 raw signals filtered to 76 European ones (70 quality-verified), 60 documented deployments – 36 in Europe – across 17 countries and 32 manufacturers. Full sourced dataset in the attached report.

Everyone in this industry has opinions about UPS vendors. I wanted evidence instead. So we pulled 364 public signals – vendor case studies, press releases, project announcements – and filtered them down to 76 quality-verified European data points covering 36 documented deployments across 12 European countries. The question: who actually wins the 1–2 MW UPS deals in European data centers, and what gets deployed?

What the evidence shows.

ManufacturerDocumented European deployments (1–2 MW)Common families
Vertiv7Liebert EXL S1, APM2, Trinergy
Riello UPS6Multi Power, Master Plus
Kohler4PW 9250DPA, PowerWAVE 6000
Borri3n/a
Schneider Electric2Galaxy VX, Galaxy NX
ABB2HiPerGuard (solid-state MV)
AEG Power Solutions2n/a
Hitec Power Protection2dynamic UPS
Others (Eaton, Delta, Centiel, Piller, Rolls-Royce…)1 eachmixed

Vertiv remains the leader – 7 of 36 documented European deployments, from the University of Southampton (1.6 MW) to Conapto Stockholm North running on lithium-ion. But the surprise of the expanded dataset is Riello UPS at 6: quietly winning mid-size deals, especially in the UK, often replacing older systems with modular Multi Power units. Kohler’s 4 deployments tell a similar mid-market story. ABB plays a different game – fewer wins, but its HiPerGuard solid-state medium-voltage UPS at Ark Data Centres’ 25 MW Surrey campus points at where the high end is going.

Three patterns stand out. First, modularity has become the default – 15 of 36 deployments are explicitly modular, and it is not hard to see why: capacity that grows with the load beats a monolith you oversize on day one. Second, lithium-ion is displacing VRLA – 5 documented deployments already run Li-ion strings, and battery replacement projects consistently move in one direction. Third, static UPS overwhelmingly dominates: just 2 dynamic deployments in the entire dataset.

A note on method, because averages lie and vendor marketing lies more: every deployment in this dataset is tied to a public, verifiable source – the full list with deployment IDs, sources and confidence ratings is in the report below. Where the evidence was thin, the report says so. (And yes – the dataset skews toward the UK, home to 15 of the 36 deployments; documented evidence follows the markets that publish it.) This is not a market-share study; it is documented-deployment evidence, which is a different and, I would argue, more honest thing.

📄 Full research report (60 deployments, all sources): Download the PDF

Which UPS platform runs your critical load – and would you choose it again? 👇

#DataCenters #UPS #PowerInfrastructure #CriticalInfrastructure

Related articles:

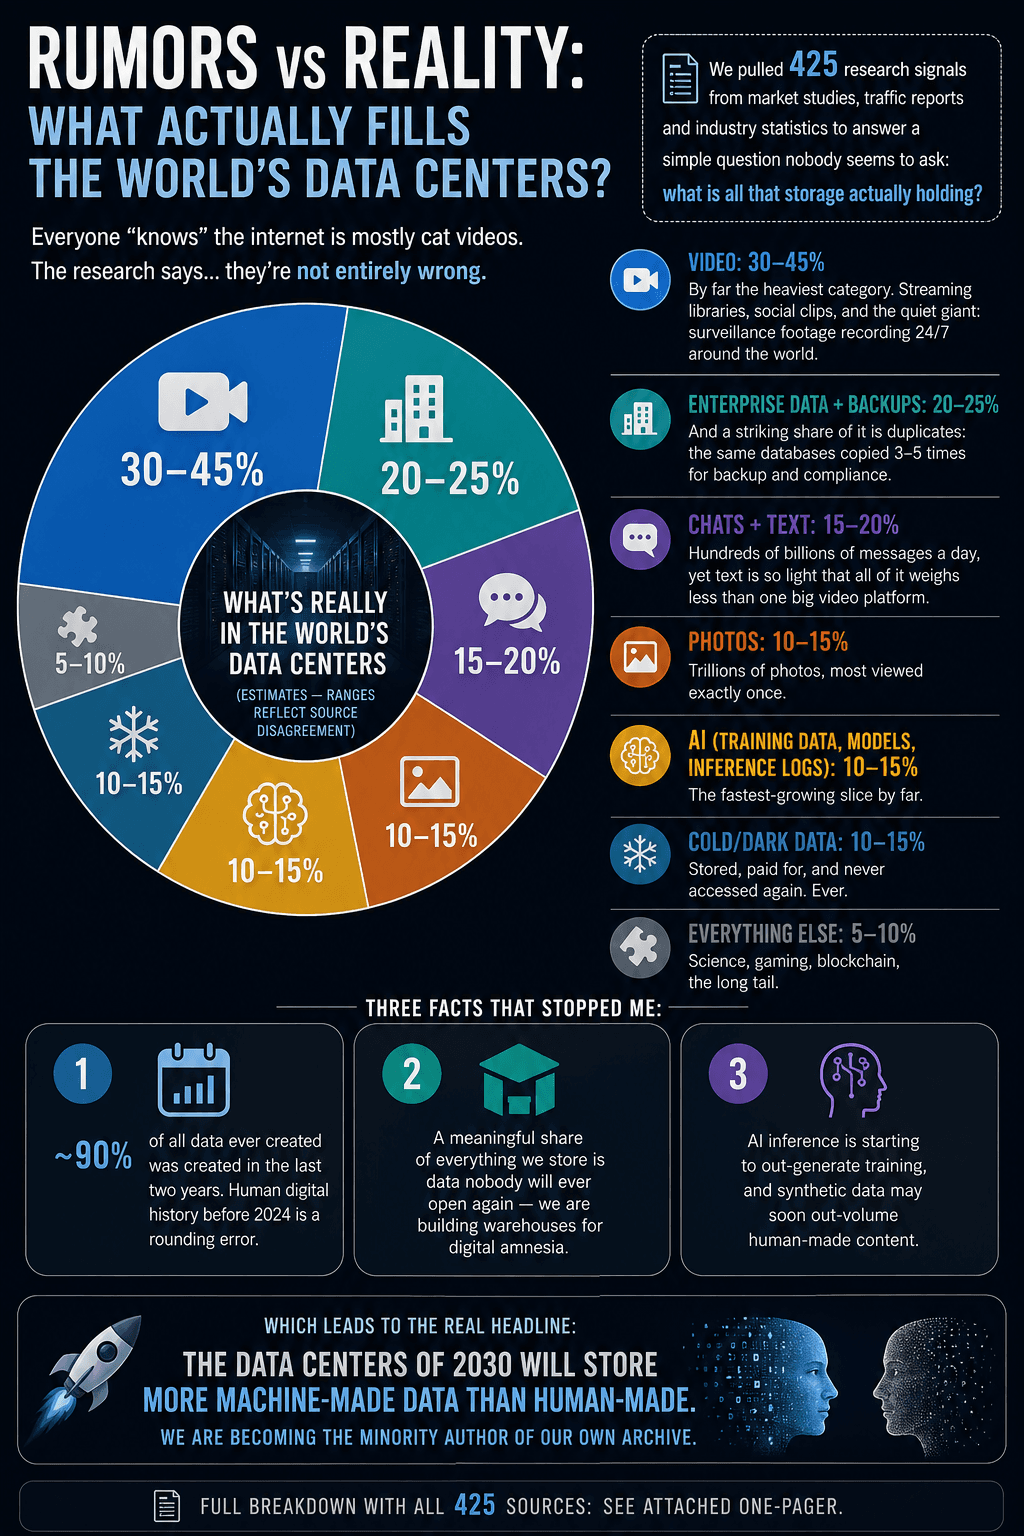
Inside the Global Data Cloud: What Our Data Centers Really Store

What fills the world's data centers - breakdown of global storage by content type

Key takeaways

  • Video is 30–45% of everything data centers store – streaming libraries, social clips and 24/7 surveillance footage.
  • Enterprise data and backups take 20–25%, and a striking share is duplicates – the same databases copied 3–5 times.
  • AI data (training, models, inference logs) is 10–15% and the fastest-growing slice; cold “dark data” nobody will ever open again is another 10–15%.
  • About 90% of all data ever created was created in the last two years – and by 2030 data centers may store more machine-made than human-made data.

Rumors vs Reality: what actually fills the world’s data centers? 🗄️

Everyone “knows” the internet is mostly cat videos. The research says… they’re not entirely wrong.

We pulled 425 research signals from market studies, traffic reports and industry statistics to answer a simple question nobody seems to ask: what is all that storage actually holding?

Best-evidence breakdown (estimates – ranges reflect source disagreement):

📹 Video: 30–45% – by far the heaviest category. Streaming libraries, social clips, and the quiet giant: surveillance footage recording 24/7 around the world.
🏢 Enterprise data + backups: 20–25% – and a striking share of it is duplicates: the same databases copied 3–5 times for backup and compliance.
💬 Chats + text: 15–20% – hundreds of billions of messages a day, yet text is so light that all of it weighs less than one big video platform.
📷 Photos: 10–15% – trillions of photos, most viewed exactly once.
🤖 AI (training data, models, inference logs): 10–15% – the fastest-growing slice by far.
🧊 Cold/dark data: 10–15% – stored, paid for, and never accessed again. Ever.
🧩 Everything else: 5–10% – science, gaming, blockchain, the long tail.

Three facts that stopped me:

1️⃣ ~90% of all data ever created was created in the last two years. Human digital history before 2024 is a rounding error.
2️⃣ A meaningful share of everything we store is data nobody will ever open again – we are building warehouses for digital amnesia.
3️⃣ AI inference is starting to out-generate training, and synthetic data may soon out-volume human-made content.

Which leads to the real headline: the data centers of 2030 will store more machine-made data than human-made. We are becoming the minority author of our own archive.

Full breakdown with all 425 sources in the attached one-pager.

What share surprised you most? 👇

#DataCenters #BigData #AI #TechTrends

https://www.linkedin.com/posts/andrisgailitis_zettabytes-unpacked-the-real-contents-of-ugcPost-7492302135053946880-8U6D/

Related articles:

Liquid Cooling vs Air Cooling in Data Centers: The Real Economics

Air cooling vs liquid cooling loops in a modern AI data center

Liquid cooling is cheaper to operate than air cooling at scale for one dominant reason: every megawatt moved from air to liquid escapes the chiller – the most expensive component in the cooling chain. But air cooling never disappears entirely. This guide explains the real economics of the air/liquid split in an AI-era data center, based on our experience planning new builds at DELSKA.

Key takeaways

  • Direct-to-chip liquid cooling captures roughly 70–85% of rack heat; memory, NICs, power supplies and optics still reject to air, creating a structural floor of about 15–20% air cooling in any large deployment.
  • Air and liquid are different thermodynamic worlds: the air loop runs on low-temperature water (about 7°C to low-20s°C) and needs chillers; the high-temperature liquid loop returns water at 60–70°C and can reject heat with dry coolers alone, year-round, almost anywhere in Europe.
  • The “chiller tax” is the economic core: chillers carry the highest capex, maintenance, F-gas regulatory exposure and compressor energy – hitting PUE directly. Liquid megawatts do not pay it.
  • At 60–70°C, return water is near-ready district heating supply – in Germany a permitting argument and a potential revenue line under the Energy Efficiency Act.
  • Design conclusion: fix the power blocks, not the cooling ratio. Make power infrastructure technology-agnostic and let the cooling mix follow tenant demand.

Definitions

  • Direct-to-chip (DLC) liquid cooling – cold plates on CPUs/GPUs transfer heat to a liquid loop, removing the majority of rack heat without moving air.
  • Chiller – a compressor-based refrigeration machine producing chilled water for the air-cooling loop; the most expensive element of the chain in capex, maintenance and energy.
  • Dry cooler – a heat exchanger rejecting heat to ambient air without compressors or refrigerants; works alone when loop temperatures are high enough.
  • PUE (Power Usage Effectiveness) – total facility power divided by IT power; compressor energy is one of its biggest drivers.
  • Chiller tax – our shorthand for the combined capex, opex, F-gas exposure and PUE penalty that every air-cooled megawatt carries and liquid-cooled megawatts avoid.

Air vs liquid: the comparison

DimensionAir cooling loopHigh-temp liquid loop (DLC)
Working temperature~7°C to low-20s°C water60–70°C return water
Heat rejectionChillers required (at least for peak trimming)Dry coolers alone, 365 days, virtually anywhere in Europe
Compressors / refrigerantsYes – capex, maintenance, F-gas exposureNone
PUE impactCompressor energy hits PUE directlyMinimal mechanical cooling energy
Share of rack heat (AI hall)Structural floor of ~15–20%~70–85% via direct-to-chip
Heat reuse readinessNeeds heat pump upgrade to be usefulNear district-heating grade as-is
Scaling behaviourShare shrinks as facility growsShare grows with rack density

Why the air share shrinks as facilities scale

When we started planning our new builds we assumed roughly 20% air / 80% liquid. Then we noticed the larger the facility gets, the smaller the air percentage becomes – not by choice, but because physics and economics push it there. Every air-cooled megawatt pays the chiller tax; every liquid megawatt escapes it into dry cooler economics. At scale, that difference compounds.

And yet air never reaches zero. Even in a “fully liquid” AI hall, the residual heat from memory, NICs, power supplies and optics – plus network cores, storage and support infrastructure – lands at about 15–20% air. That is not a design choice. That is physics, at least until chip makers eliminate air-cooled components entirely.

Two loops, not one

One shared water system is not realistic: the loops live at completely different temperatures. What you can share is the top layer – the heat rejection field masterplan, water treatment, and BMS. The hydraulic circuits stay separate.

Waste heat: from cost to revenue

At high-temperature DLC return levels you are sitting on near-ready district heating supply. In Germany, where the Energy Efficiency Act requires heat reuse readiness for large data centers, 60–70°C return water stops being an ESG talking point and becomes a permitting argument – and potentially a revenue line. Lower-temperature loops need a heat pump in between. See the EU Data Centre Regulation Tracker for country-by-country heat reuse rules.

The design conclusion: fix the power blocks

Do not fix the air/liquid ratio in concrete. Design transformers, distribution and UPS topology to be technology-agnostic. Oversize pipes, headers and pump capacity in phase one – cheap now, brutally expensive later – and pre-reserve dry cooler positions in the field masterplan. Then let the cooling mix follow tenant demand, phase by phase. Only one thing in the building is permanent: power.

Frequently asked questions

Can a data center be 100% liquid cooled?

Not today. Direct-to-chip captures 70–85% of rack heat, but memory, power supplies, optics, network and storage still reject heat to air – a structural floor of roughly 15–20% until component design changes.

Does liquid cooling improve PUE?

Yes, primarily by removing compressor energy: high-temperature loops reject heat through dry coolers without chillers, and chiller compressor energy is one of the largest PUE drivers in air-cooled facilities.

Is liquid cooling worth it for existing facilities?

Retrofits are far more expensive than new builds designed for it. The economical path is hybrid: keep the air loop as a service layer and add liquid capacity where rack density demands it – if the pipes and pumps were sized for it in phase one.

Related articles

EU Data Centre Regulation Tracker: Energy, Heat Reuse and PUE Rules by Country

Map and overview of EU data centre waste heat reuse regulation by country

Data centre operators in the EU are now subject to binding energy and heat reuse rules, and the requirements differ sharply by country. This tracker summarises what applies where: the EU-wide framework, each national transposition, thresholds, quotas, deadlines and penalties – in one place. Last updated: 27 July 2026.

Key takeaways

  • The EU Energy Efficiency Directive (EED, 2023/1791) requires annual public reporting for data centres with ≥500 kW IT power and waste heat reuse for facilities >1 MW unless technically or economically infeasible.
  • Germany is the strictest market: waste heat reuse quotas of 10/15/20% from July 2026/2027/2028, 100% renewable electricity by 2027, PUE ceilings, and fines up to €100,000 – applying from just 300 kW.
  • National approaches diverge widely: France regulates from 100 kW, Austria has obligations without quotas, the Nordics rely on voluntary district heating partnerships, the Netherlands and Ireland use moratoriums and grid connections as the lever.
  • A second EU regulatory wave lands in 2026: the Data Centre Energy Efficiency Package, an EU-wide sustainability rating scheme, and an expected Cloud and AI Development Act.
  • Site selection economics are shifting from “cheap power + cool climate” to “cheap power + cool climate + heat off-taker”.

The EU-wide framework

Three instruments form the federal layer. The recast Energy Efficiency Directive (EED, Directive (EU) 2023/1791, in force since 2023) created the first EU-wide obligations: annual public reporting of energy performance for data centres with an installed IT power demand of 500 kW or more, and a soft mandate for facilities above 1 MW to reuse waste heat unless it is technically or economically infeasible. The Renewable Energy Directive (REDIII) adds renewable energy obligations, and a March 2024 Delegated Regulation established a common EU rating scheme for data centre sustainability reporting.

Definitions

  • EED – the EU Energy Efficiency Directive (2023/1791), the primary EU law regulating data centre energy performance.
  • PUE (Power Usage Effectiveness) – total facility energy divided by IT energy; 1.0 is theoretically perfect, and regulatory ceilings typically target 1.2–1.5.
  • Waste heat reuse – capturing heat rejected by IT equipment and supplying it to consumers such as district heating networks, instead of venting it to the atmosphere.
  • Heat off-taker – a customer (city network, industrial site, campus) that accepts and uses a data centre’s waste heat.

Country-by-country tracker

CountryApplies fromKey obligationsEnforcement
Germany (EnEfG, 2023)300 kWPUE ceilings; hard waste heat reuse quotas of 10/15/20% from July 2026, 2027, 2028; 100% renewable electricity by 2027Fines up to €100,000 per violation
France100 kW (reporting)Energy reporting from 100 kW; waste heat recovery obligations from 1 MWNational energy authority oversight
Austria (EEffG, April 2024)Reporting thresholds per EEDReporting plus a general waste heat utilisation obligation; no tiered quotasAdministrative penalties
NetherlandsCase-by-caseMoratoriums and grid connection conditions used as primary lever; hyperscale permits restrictedPermitting and grid access
IrelandCase-by-caseDe facto moratorium in Dublin region via grid connection policyGrid operator (EirGrid) conditions
Nordics (SE, FI, DK, NO)VoluntaryHeat reuse driven by mature district heating markets and commercial partnerships rather than mandatesMarket-based
Switzerland (non-EU)>2 GWh waste heatData centres above 2 GWh must supply waste heat to third parties at costCantonal implementation

The 2026 second wave

The European Commission has confirmed a Data Centre Energy Efficiency Package alongside the Strategic Roadmap on Digitalisation and AI for the Energy Sector (Q1–Q2 2026), plus an EU-wide sustainability rating scheme adopted in Q2 2026. Minimum performance standards and a Cloud and AI Development Act are expected to follow. For operators this means the reporting-only phase is ending: performance floors and rating-linked obligations are next.

What this means for operators and investors

  • Site selection now has a third variable: proximity to a heat off-taker is becoming as important as power price and climate.
  • High-temperature liquid cooling (60–70°C return water) turns compliance into revenue: it is near-ready district heating supply, while low-temperature loops need heat pumps in between.
  • Germany rewards early movers: facilities designed for heat reuse gain a permitting argument, not just an ESG talking point.
  • Retrofitting heat reuse into an existing air-cooled facility is far more expensive than designing for it – oversize pipes and reserve dry cooler positions in phase one.

Frequently asked questions

Do the EU rules apply to small server rooms?

No. The EED reporting obligation starts at 500 kW installed IT power. Germany goes further, applying national obligations from 300 kW, and France requires reporting from 100 kW.

Is waste heat reuse mandatory everywhere in the EU?

Not unconditionally. The EED requires reuse for facilities above 1 MW unless technically or economically infeasible – the feasibility test is the operative clause. Germany is the exception, with hard quotas that apply regardless.

Which EU country is hardest for data centre compliance?

Germany, by a distance: the lowest threshold (300 kW), hard reuse quotas, a renewable electricity mandate from 2027, PUE ceilings and six-figure fines.

Related articles

The Only Constant in a Modern Data Center Is Power

Air cooling vs liquid cooling loops in a modern AI data center

Key takeaways

  • Direct-to-chip liquid cooling captures 70–85% of rack heat; the rest still rejects to air – a structural floor of about 15–20% air in any large deployment.
  • Air and liquid loops run at completely different temperatures (about 7–20°C vs 60–70°C) and cannot realistically share one water system.
  • Every megawatt moved from air to liquid escapes the “chiller tax” – the capex, maintenance, F-gas exposure and PUE penalty of compressor-based cooling.
  • Design conclusion: keep power infrastructure technology-agnostic and let the cooling mix follow tenant demand.

Everything else – especially cooling – is a variable.

When we started planning our new data center builds, we began with what felt like a safe assumption: roughly 20% air cooling, 80% liquid. A reasonable split for an AI-era facility.

Then we noticed something. The larger the facility gets, the smaller the air percentage becomes – not because we decided so, but because the physics and the economics push it there. And yet air never reaches zero. Here’s what we’ve learned designing around that tension.

Air cooling doesn’t disappear – it becomes a service layer.

Even in a “fully liquid” AI hall, direct-to-chip cooling captures roughly 70–85% of rack heat. The rest – memory, NICs, power supplies, optics – still rejects to air. Add network cores, storage, and support infrastructure, and you land at a structural floor of about 15–20% air in any large deployment. That’s not a design choice. That’s physics, at least until chip makers eliminate air-cooled components entirely.

These are two different thermodynamic worlds.

Here’s what gets glossed over in most “hybrid cooling” discussions: air and liquid loops don’t just differ in medium – they live at completely different temperatures.

The air-cooling loop is a low-temperature water system, typically operating anywhere from about 7°C up to the low-20s°C depending on facility design and economization strategy – which means chillers, at least for peak trimming. By contrast, the high-temperature liquid-cooling loop can return water at 60–70°C – and at those temperatures, dry coolers alone handle heat rejection year-round, virtually anywhere in Europe. No compressors. No refrigerants. Free cooling, 365 days.

One shared water system? Not realistically. What you can share is the top layer: the heat rejection field masterplan, water treatment, BMS. The hydraulic circuits themselves stay separate.

Every megawatt you move from air to liquid escapes the chiller tax. This is the economic insight hiding inside the ratio question. Chillers are the most expensive component of the cooling chain – capex, maintenance, F-gas regulatory exposure, and above all compressor energy that hits your PUE directly.

Shift a megawatt from air to liquid, and it doesn’t just change cooling technology. It moves from chiller economics to dry cooler economics. That’s why the air percentage naturally shrinks as facilities scale: every air-cooled megawatt carries a chiller tax that liquid megawatts don’t pay.

70°C return water isn’t waste – it’s an asset. At high-temperature DLC return levels, you’re sitting on near-ready district heating supply. In Germany, where the Energy Efficiency Act already requires heat reuse readiness for large data centers, this stops being an ESG talking point and becomes a permitting argument – and potentially a revenue line. Lower-temperature liquid loops need a heat pump in between; at 60–70°C, you’re much closer to plug-and-play.

So what does this mean for design? Our conclusion: don’t fix the air/liquid ratio in concrete. Fix the power blocks.

Design power infrastructure – transformers, distribution, UPS topology – to be technology-agnostic. Oversize the pipes, headers, and pump capacity in phase one (cheap now, brutally expensive later). Then let the cooling mix follow tenant demand, phase by phase, with dry cooler positions pre-reserved in the field masterplan.

Because in the end, only one thing in the building is permanent: power. Everything downstream of the busbar should be ready to change.

How are you approaching the air/liquid split in your new builds? Curious whether others are seeing the same structural floor around 15–20% air.

#DataCenters #LiquidCooling #AIInfrastructure #Sustainability #DistrictHeating #PUE

https://www.linkedin.com/pulse/only-constant-modern-data-center-power-andris-gailitis-jayrf

Related articles:

Data Centre Waste Heat Reuse Regulation in the EU

Map and overview of EU data centre waste heat reuse regulation by country

Key takeaways

  • The EU Energy Efficiency Directive (2023/1791) requires annual public reporting from 500 kW IT power and waste heat reuse above 1 MW unless infeasible.
  • Germany is the strictest: reuse quotas of 10/15/20% from July 2026/2027/2028, 100% renewable electricity by 2027, fines up to €100,000 – from just 300 kW.
  • National rules diverge: France regulates from 100 kW, Austria has no quotas, the Nordics rely on voluntary district heating partnerships, the Netherlands and Ireland use moratoriums and grid access.
  • A second EU wave arrives in 2026 – site selection is shifting to “cheap power + cool climate + heat off-taker”.

Heat reuse from data centres is no longer purely voluntary in Europe. The 2023 recast Energy Efficiency Directive (EED, Directive (EU) 2023/1791) created the first EU-wide framework: annual public reporting for facilities ≥500 kW IT power, and a soft mandate for facilities >1 MW to reuse waste heat unless technically or economically infeasible. The Renewable Energy Directive (REDIII) and a March 2024 Delegated Regulation establishing a common EU rating scheme complete the federal layer.

National transpositions diverge sharply. Germany’s Energy Efficiency Act (EnEfG, 2023) is the strictest: PUE ceilings, hard waste heat reuse quotas (10/15/20% from July 2026, 2027, 2028), 100% renewable electricity by 2027, and fines up to €100,000 per violation, applied from 300 kW. France imposes reporting from 100 kW and waste heat recovery from 1 MW. Austria’s EEffG (April 2024) introduces reporting and a general waste heat utilisation obligation but no tiered quotas. Switzerland (non-EU) requires data centres >2 GWh waste heat to supply third parties at cost. The Nordics drive heat reuse mostly through voluntary partnerships with mature district heating networks rather than mandates. The Netherlands and Ireland have used moratoriums and grid connection conditions as their primary lever.

A second EU regulatory wave is now imminent. The Commission has confirmed a Data Centre Energy Efficiency Package alongside the Strategic Roadmap on Digitalisation and AI for the Energy Sector in Q1–Q2 2026, plus an EU-wide sustainability rating scheme adopted in Q2 2026. Minimum performance standards and a Cloud and AI Development Act are expected to follow. Site selection economics across the bloc are shifting from ‘cheap power + cool climate’ to ‘cheap power + cool climate + heat off-taker’.

#DataCenters #WasteHeatRecovery #EnergyEfficiency #DistrictHeating #EUPolicy #EnEfG #Sustainability #GreenIT #Colocation #DigitalInfrastructure

https://www.linkedin.com/pulse/data-centre-waste-heat-reuse-regulation-eu-andris-gailitis-o4igf

Related articles:

Europe Is Investing Heavily in AI Infrastructure – But There’s an Uncomfortable Gap We Don’t Talk About Enough

EU funding for GPU clusters, supercomputers, data centers and AI competence centers

Key takeaways

  • EU funding for AI infrastructure (GPU clusters, supercomputers, data centers) is mostly CAPEX – the real long-term challenge is OPEX: electricity, cooling, engineers and upgrades.
  • Funding typically covers 2–5 year projects; afterwards either state budgets absorb the running costs or the infrastructure must become commercially viable.
  • Without sustainable operating models and an energy strategy, Europe risks building infrastructure that is underutilized, uncompetitive or financially unsustainable.
  • AI sovereignty requires funding outcomes, not just assets.

Across the EU, governments (with support from the European Commission) are funding GPU clusters, supercomputers, data centers and AI competence centers. This is great – and necessary. But most of this funding is CAPEX (buying and building the infrastructure).

The real challenge? OPEX. Running AI at scale means:

  • ⚡ Massive electricity consumption
  • ❄️ Cooling and data center operations
  • 👨‍💻 Skilled engineers and ongoing maintenance
  • 🔄 Continuous hardware and software upgrades

And unlike the initial investment, these costs don’t go away.

In many cases, funding covers 2–5 year projects. After that:

  • Either the state budget absorbs the cost
  • Or the infrastructure must become commercially viable

That’s where things get tricky. Because AI today is not cheap:

  • Training models can cost millions
  • Even inference (serving models) requires constant GPU usage
  • Energy prices in Europe make everything more expensive

The result? We risk building impressive infrastructure that is underutilized, not globally competitive, or financially unsustainable long-term.

This isn’t a criticism – it’s a structural issue.

If Europe wants to be serious about AI sovereignty, we need to think beyond “building infrastructure” and address:

  • sustainable operating models
  • energy strategy for AI
  • public–private usage frameworks
  • long-term funding mechanisms

Otherwise, we’re funding assets – but not outcomes.

Curious to hear how others see this: Is Europe underestimating the cost of actually running AI?

#AI #Europe #DataCenters #HPC #Supercomputing #ArtificialIntelligence #DigitalInfrastructure #Energy #Innovation #TechPolicy #AIStrategy #capex #opex

https://www.linkedin.com/pulse/europe-investing-heavily-ai-infrastructure-theres-gap-gailitis-z4sbf

Related articles:

I Ran the Numbers: If You Filled a 1MW Data Center With iPhones – Here’s the Theoretical Compute Power You’d Get

Server racks filled with iPhones in a 1MW data center thought experiment

Key takeaways

  • A 1MW data center could power about 250,000 iPhone 16 Pro Max units (~4W each under sustained load).
  • On paper that is ~1 ExaFLOP of FP32 GPU compute – exascale territory, rivaling the Frontier supercomputer.
  • Mobile chips are ~10x more power-efficient than data-center GPUs (~1 TFLOPS/W vs ~0.1 TFLOPS/W for an NVIDIA H100).
  • Reality check: thermal throttling, interconnect bandwidth and sustained-load limits make this a thought experiment, not a build plan.

Great thought experiment! Let me work through this. The newest iPhone is the iPhone 16 Pro Max (A18 Pro chip, released Sept 2024).

How many iPhones? Under sustained heavy computational load, an iPhone 16 Pro Max draws roughly ~4 watts. That means 1,000,000W ÷ 4W = ~250,000 iPhones.

The A18 Pro chip has three compute engines.

GPU – ~4 TFLOPS (FP32) per device. 250,000 × 4 TFLOPS = 1 ExaFLOP – that’s exascale territory, matching the world’s most powerful supercomputers.

Neural Engine – 35 TOPS (INT8) per device. 250,000 × 35 TOPS = 8.75 PetaOPS for AI/ML inference workloads.

CPU – ~0.6 TFLOPS per device. 250,000 × 0.6 TFLOPS = ~150 PetaFLOPS.

Efficiency is actually impressive. The A18 Pro delivers roughly ~1 TFLOPS/W (GPU), while a data center-grade NVIDIA H100 GPU delivers ~0.1 TFLOPS/W (FP32). Mobile chips are extraordinarily power-efficient by comparison – they just can’t run continuously at peak without throttling.

Physical reality check: each iPhone 16 Pro Max is about 163 × 78 × 8.3 mm. 250,000 of them occupy roughly 26 cubic meters – filling only about 18 standard server racks physically, though cooling all those densely packed devices would be an engineering nightmare.

MetricValue
iPhones needed~250,000
GPU compute~1 ExaFLOP (FP32)
AI inference~8.75 PetaOPS (INT8)
Physical volume~26 m³ (~18 racks)
Cost (at ~$1,200/unit)~$300 million

The compute number is genuinely staggering – on paper it rivals Frontier, the world’s first exascale supercomputer – but of course real-world use would be limited by thermal throttling, interconnect bandwidth, and the fact that iPhones aren’t designed for sustained 100% load.

#DataCenters #AIInfrastructure #Compute #iPhone #HPC #EnergyEfficiency

https://www.linkedin.com/pulse/i-ran-numbers-you-filled-1mw-data-center-iphones-heres-gailitis-0rvtc

Related articles:

Be Among the First: Join the Launch of a Next-Generation AI Data Center in Riga

Delska EU North Riga LV DC1 - grand opening of the most sustainable AI-ready 10MW data center in the Baltics

Key takeaways

  • Delska EU North Riga LV DC1 – a 10 MW facility expandable to 30 MW, designed for AI, HPC and sovereign digital infrastructure – opened on 15 April 2026 in Riga.
  • Up to 250 kW per rack with hybrid CoolWall air + liquid cooling, powered by 100% renewable energy.
  • Tier III design with 99.982% uptime and a 400G connectivity backbone across Europe.

On April 15, 2026, we will unveil something that goes beyond a traditional data center. We are opening Delska EU North Riga LV DC1 – the most advanced and sustainable data center ever built in the Baltics. A 10 MW facility designed not for today’s workloads, but for what comes next: AI, HPC, and sovereign digital infrastructure in Northern Europe.

This is a strategic milestone not only for Delska, but for the region.

To mark this launch, we are bringing together government representatives, global technology partners, and senior industry leaders to explore the future of compute, energy, and digital sovereignty.

📅 April 15, 2026
📍 Riga, Latvia · In-person & Live Stream (RSVP required)
👉 Register: delska.com/lvdc1-launch-event

EU North Riga LV DC1 is built with a clear promise: infrastructure must scale with ambition.

  • 10 MW capacity, expandable to 30 MW on secured land with reserved power
  • Up to 250 kW per rack to support AI and HPC workloads at scale
  • Hybrid cooling architecture combining CoolWall air and liquid cooling
  • Powered by 100% renewable energy from Northern Europe
  • Designed to Tier III standards with 99.982% uptime
  • 400G connectivity backbone with low-latency access across Europe

This is not just an improved data center. It is a platform for next-generation compute deployment.

The opening will take place in two parts.

Private Opening Ceremony (invitation-only | live streamed) – featuring government leaders and strategic partners, setting the tone for the region’s digital future.

Executive Program (RSVP required) – with contributions from Dell Technologies, Veeam, 11Stream, and Delska, alongside:

  • Forward-looking perspectives on AI infrastructure and sovereign compute
  • Exclusive guided access to the facility
  • High-value networking with the regional and international tech ecosystem

We also have opened reservation access for organizations planning their next phase of infrastructure growth. If you cannot attend our launch event but would like to tour the facility on a private visit, please drop us a message – sales@delska.com.

👉 Pre-book your capacity: delska.com/data-centers/eu-north-riga-lv-dc1

Facilities like this are not built often. And access at this stage is even rarer.

If you are shaping infrastructure strategy for the coming years – this is where the conversation starts. Welcome!

#AIInfrastructure #DataCenters #SovereignCompute #GreenEnergy #Baltics #DigitalTransformation

https://www.linkedin.com/pulse/among-first-join-launch-next-generation-ai-data-center-gailitis-aroof

Related articles:

Proudly powered by WordPress | Theme: Baskerville 2 by Anders Noren.

Up ↑